Category Macro / Economy

Is it Still Going to be a “Soft Landing”?

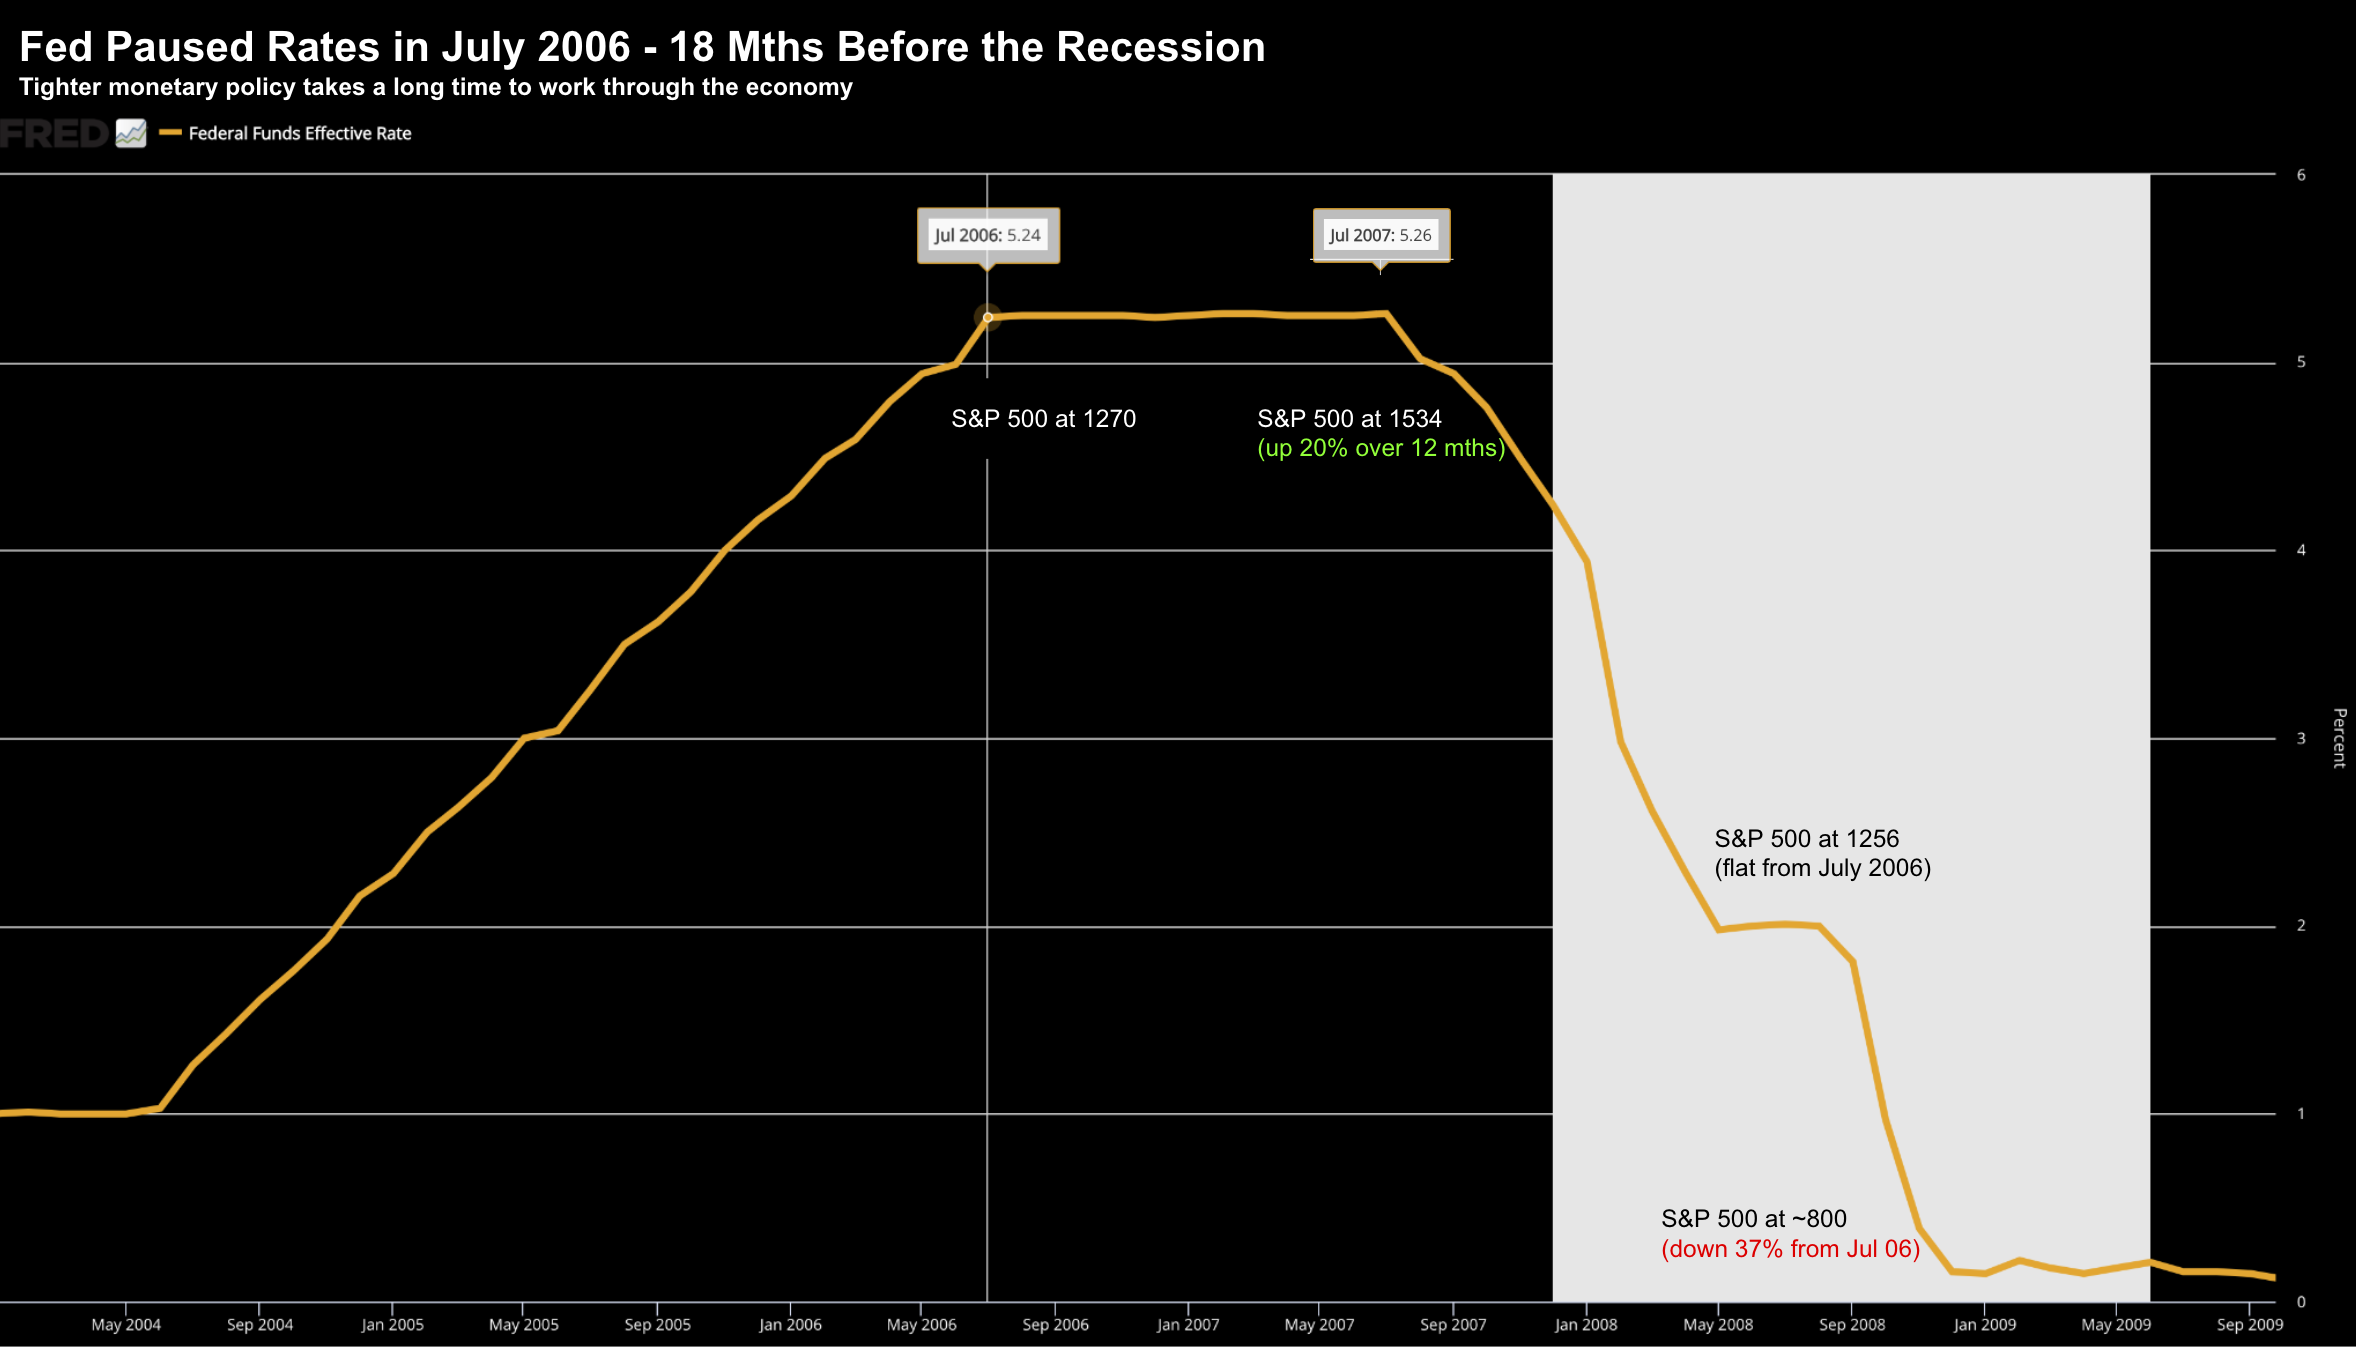
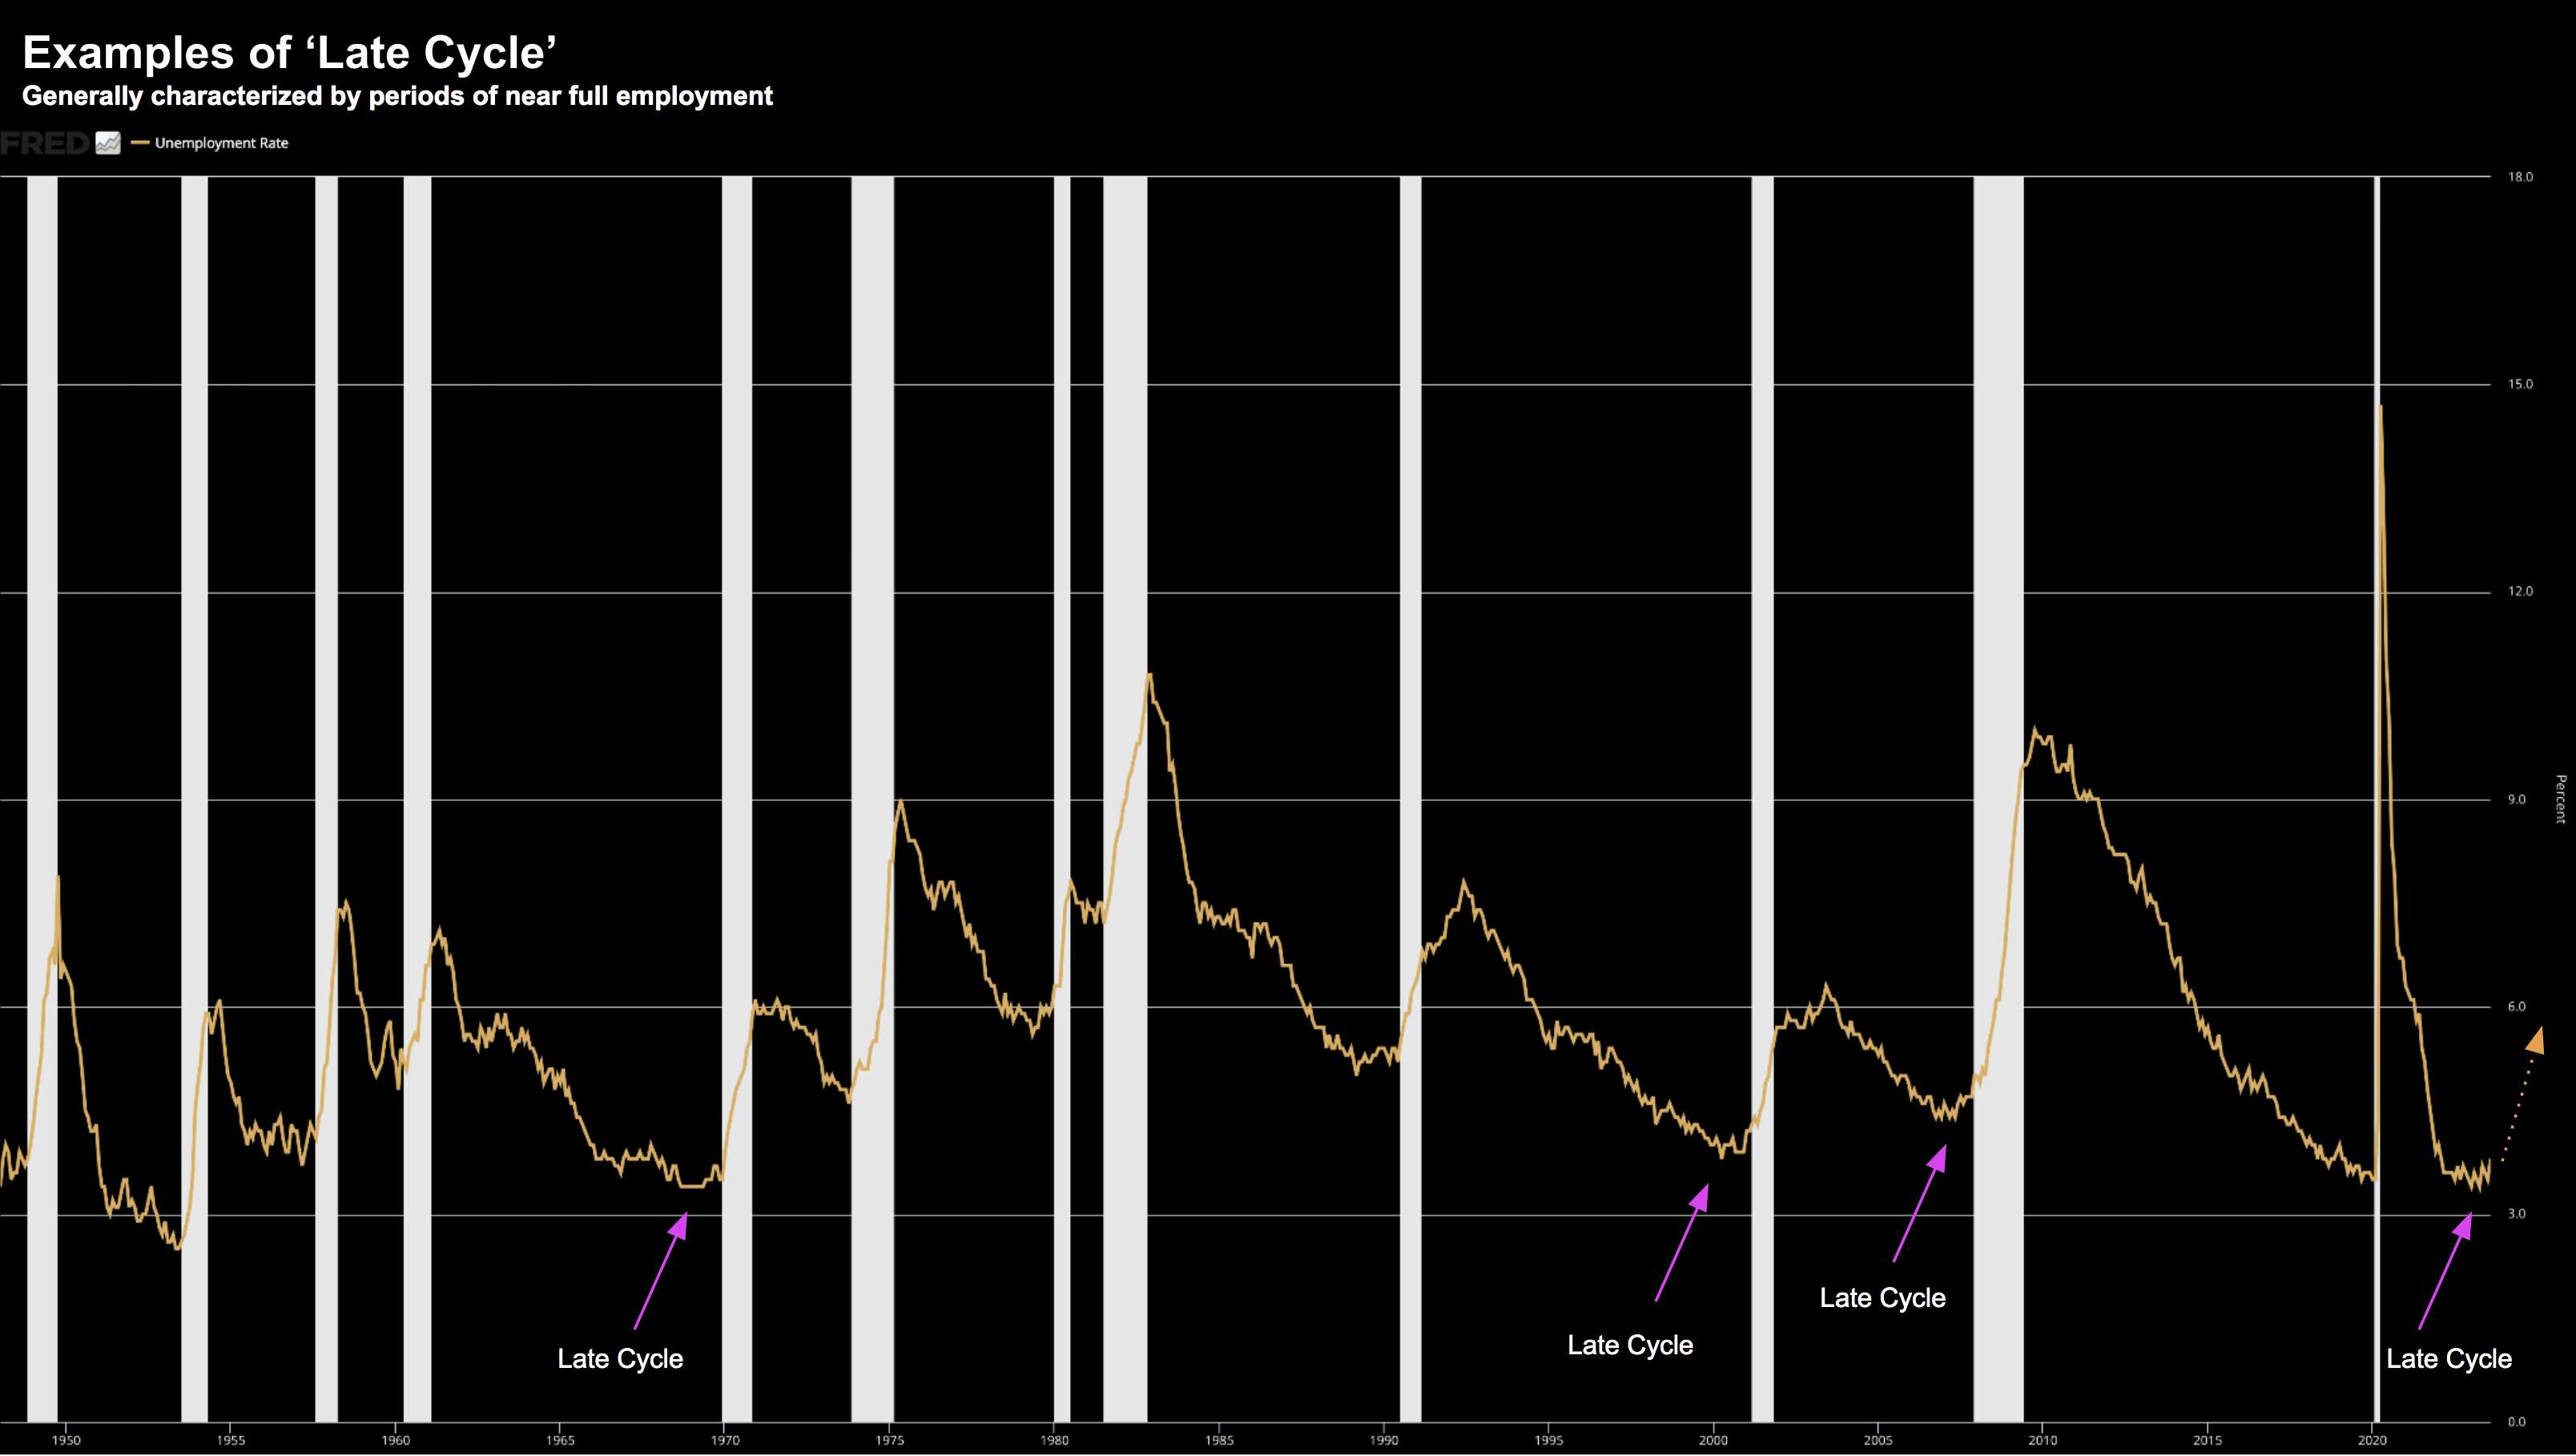
2023 has been one of the more difficult years to navigate. For example, if you chose the wrong stocks, sectors or simply decided to hide in cash - you didn't fare well. However, what's also made it hard has been the various shifts in sentiment the past ~9 months. These shifts have 'whipped' traders around. Today, with the US 10-year yield challenging almost 5.0% - the "R" word is back in the vernacular. Much of this can be explained by understanding where we are in the economic cycle... and today it's "late cycle". The challenge is navigating this phase is the most difficult of any... as it will often last longer than many expect.

Where Do We Go From Here?

Major averages pulled back this week on fears rates could remain higher for longer. Makes sense - with the US 10-year above 4.25% - that's a reasonable assumption. But here's the thing: get used to it. Whilst rates might feel 'tighter'... rates are still not historically high. Not even close. What was not normal was rates being artificially suppressed to near zero for 15 years. And that might prove to be a difficult adjustment for some people. So where to from here? The honest answer is none of us know. What follows are some of the assumptions being made; and perhaps gaps in the market's thinking... it starts by asking quality questions.

For Now… Bad News is Good News

August has proven to be a bumpy month for equities. And if the Trader's Almanac is any guide - it's not surprising. August and September are typically weaker months for stocks. For example, over the past decade, the S&P 500 has managed an average gain of 0.1% for August. Dismal. If you go back two decades, it becomes an average loss of 0.1%. Why? Maybe it's due to most of Wall Street taking summer vacation in The Hamptons - meaning trading volumes are low. Or it could be some traders locking in profits ahead of September - which boasts the worst record of any month in the calendar. For example, the S&P 500 has lost an average of 1% each September over the past 10 years.

Beware the “Bear Steepening” of the Curve

My last post talked about how the market is now taking its cues from bond yields (less so the Fed) Don't get me wrong... what the Fed does (or says) matters. We will hear more from Chair Jay Powell at the end of the week. Expect hawkish tones. To recap on what I shared earlier this week - globally long-term bond yields trade at their highest levels in 15 years. However, what's interesting is the shorter-end (e.g. 2-year and below) is not keeping pace. This has net the effect of "steepening" the all-important 10/2 yield curve. Question is - will that be a problem? History may offer some clues.

Why Core Inflation Will Remain Sticky

Markets got excited on news of the softer-than-expected CPI headline print today. Headline inflation came in at 3.2% YoY vs expectations of 3.3%. However, what deserves closer scrutiny is not the headline number - it's Core CPI at 4.7% YoY and shelter costs. For e.g., two-thirds of the monthly inflation increase came from shelter - where rents rose 0.4% MoM. This is now the 18th straight month the price of shelter has risen at least 0.4% MoM. But here's the thing - there isn't. much the Fed can do with monetary policy to change this.

Are Recession Callers Back-peddling?

It's the rally everyone loves to hate. Why? Because very few got it right. Most fund managers missed this rally entirely... thinking it was only a matter of time before things collapsed. The thing is - they haven't. I will admit - I also got this wrong. My initial target at the start of the year was 4200. If that broke - I was looking at resistance around 4500. The S&P 500 now trades 4536 - making me look foolish (and it won't be the last time I am sure). We're now just past the mid-point of the year - with the S&P 500 up 18.2% YTD. Remarkable by any measure. What are Wall St saying about the second half?

Can Consumers Continue to ‘Shop ’til they Drop’?

Never underestimate the US consumer's willingness to spend. And from mine, that's been the story of this year. Consumers have used whatever means available to spend, spend, spend. With ~70% of US GDP consumption based - that has also meant the economy managed to keep its head above water. But what does it look like going forward?Do consumers still have ultra-strong balance sheets to keep it up? And are rates eventually going to bite? I ask this because if US consumers are closer to maxing out their credit cards (with more than $1T in debt)... the odds of a recession sharply increase.

Hints of Mid-2007

It's been said that whilst history doesn't repeat - it often rhymes. For me, 2023 offers some parallels to 2007. To be clear, things are not exactly the same (they rarely are) - however I will demonstrate some similarities. What's more, I continue to remain long this market (with about 65% exposure). That said, if I'm correct (and I may not be) - it could raise a 'red flag' for 2024. Three things (1) fed monetary tightening takes between 12 and 24 months to make its full impact; (2) the economy also looked very strong into Q4 2007; and (3) sustained inverted yield curve cause recessions. In my view - the market is losing sight of the fact of how long the lag effect can be.

Bulls & Bears Can Make a Solid Case

It's fair to say this is one of the more hated stock market rallies. Why? Rarely have I seen so many caught on the wrong side of the trade. Sentiment is overwhelmingly negative. And yet the S&P 500 is up ~20% from its October low. This missive outlines both the bull and bear case. Either side can make valid arguments. This is what makes things so interesting. In short, you must have exposure to this market. However, you should do so with your eyes wide open.

Surface Cracks Appear in Credit

If there's one thing that keeps the US going... it's the availability of cheap credit. Love it or hate it - the US is a credit driven economy. If credit dries up - it's goodnight nurse. The US consumer now owes close to $1Trillion on their credit card - a 17% jump from a year ago and a record high. More than 33% U.S. adults have more credit card debt than emergency savings