 Investors Start Weighing the Risks
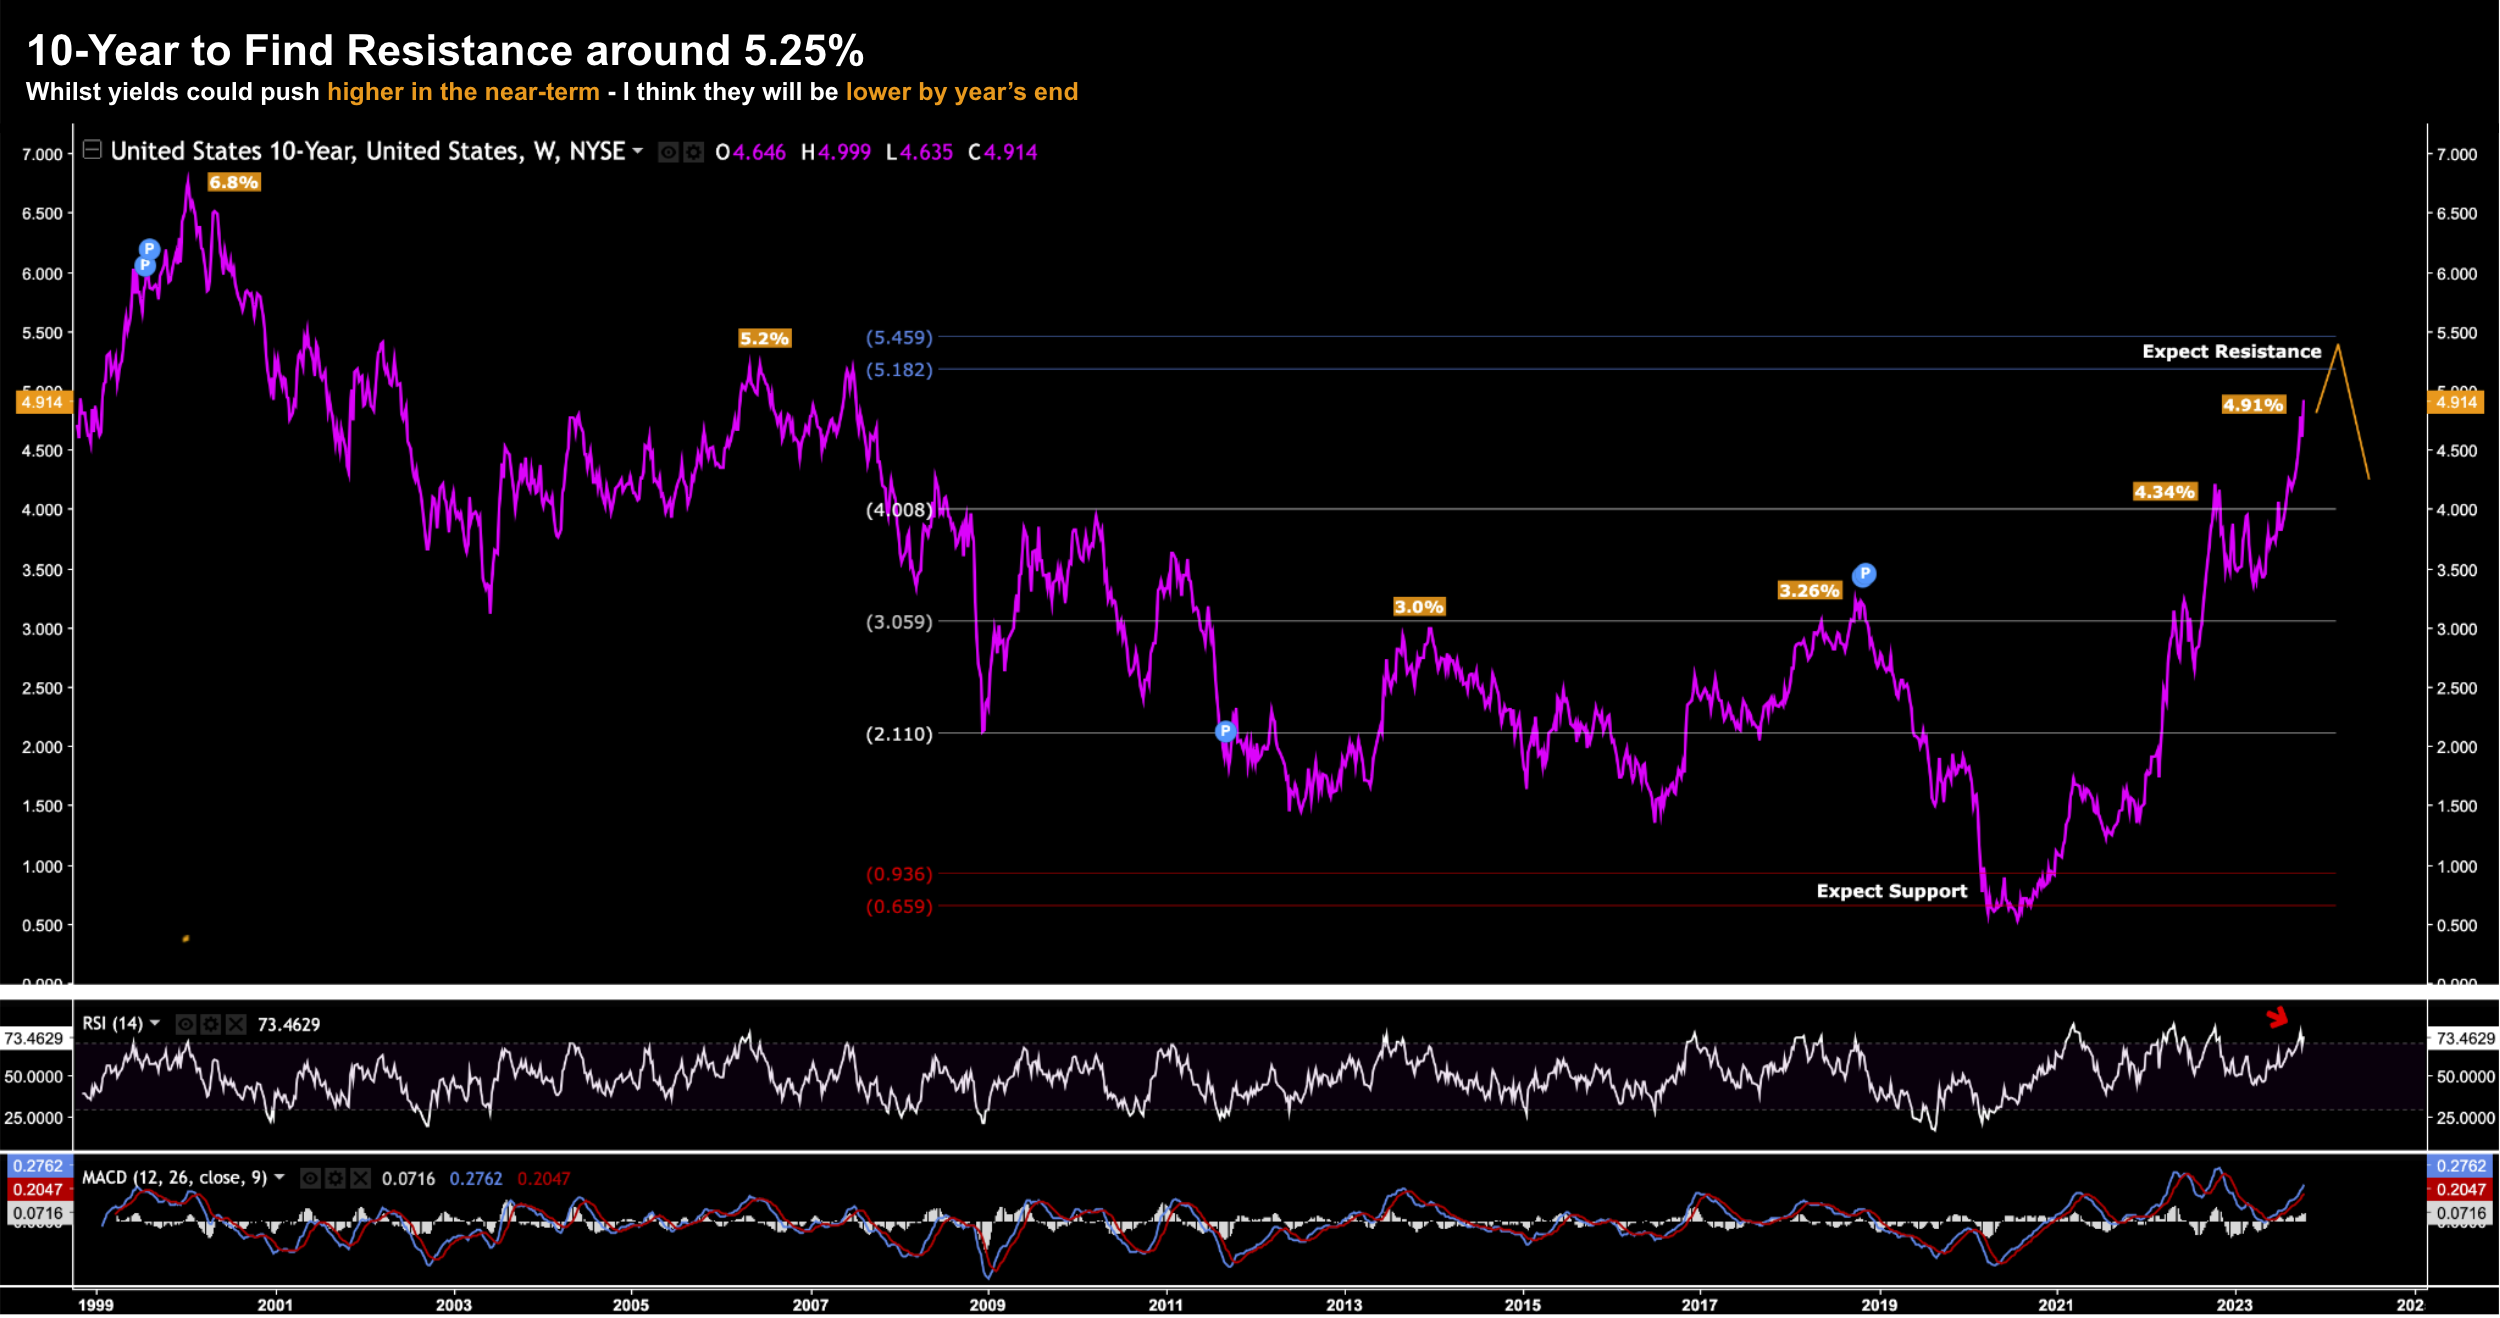
Investors have hit pause on equities - evaluating a new set of risks. For example, the S&P 500 is now trading close to the same level it was at the end of January. 8 months of gains gone! The world's largest index is up ~10% year to date... losing 2.4% this week. When you consider the S&P 500 lost ~19% last year.... it has not been a good two years. This post looks at why the outlook has deteriorated with 4 key charts: (i) 10-year yield; (ii) 10-2 yield curve; (iii) VIX; and (iv) gold - which touched $2,000 this week. What does it all mean?